Summary: Lattitude vs. Wind Speed
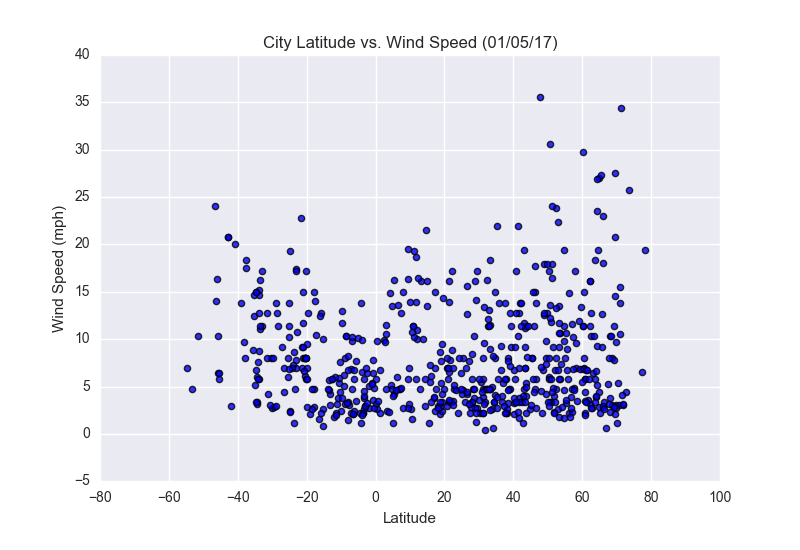
The scatterplot displays a city's wind speed in relation to it's latitude. There are noticable changes as you get closer or farther away from the equator (latitude:0). We can observe a cluser around lower wind speeds. Cities close and further away from the equator tend to have lower wind speeds. There does not seem to be a strong correlation between the two variables. It does appear that there are a few outliers, southern cities that fall in -40 to -20 Latitiude and northern cities in the 40-60 latitude have higher wind speed.
Visualizations